Ramped Bunch Experiment: Experimental Results
CTR Measurement Results
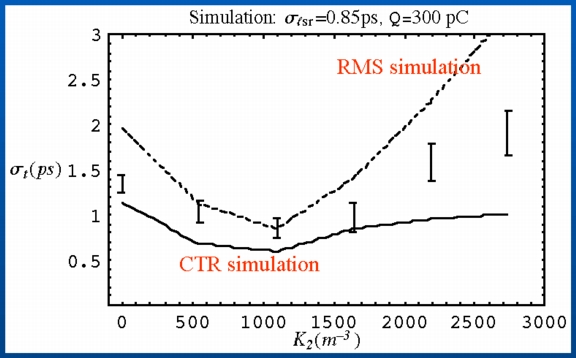
The degree of compression produced by the dogleg on a chirped electron bunch depends upon the strength of the sextupole corrector magnets. This is shown in the data plot below, where the electron bunch length is plotted as a function of sextupole strength. Simulations of the phase space and current profile are shown for various points on this plot. The maximum compression of the beam occurs at the sextupole field value [shown in part (b) of the figure] where the second order longitudinal dispersion (T566) is completely cancelled.

(Click image to enlarge plots)
To produce the data for the RMS bunch length, CTR Autocorrelation scans were performed at various sextupole settings, and the RMS bunch length was extracted from the resulting autocorrelation traces at each setting. The results, shown above, indicate that there is a sextupole field value where the bunch is maximally compressed (around 1094 inverse cubic meters). To explain this observation, simulations were performed using the tracking codes PARMELA and ELEGANT. The simulation predictions are shown by the dashed curve. The nature of the sextupole-dependent compression observed here is seen in the simulated phase space plots to correspond with a "folding over" of the beam distrubution in the longitudinal phase plane. This effect is due primarily to the second-order longitudinal dispersion (T566).
Transverse Beam Size
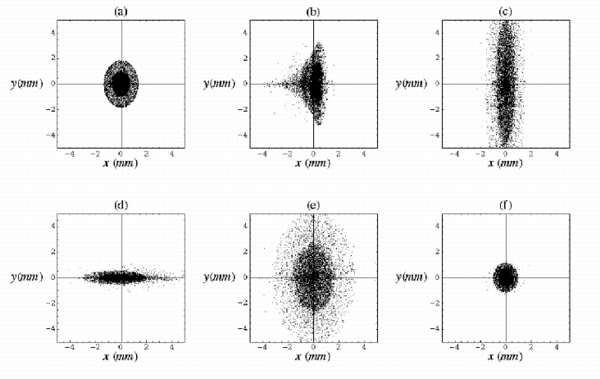
The following figure shows beam profiles taken on each of the six screens on the S-Bahn beamline. The beam charge (measured by calibrated Faraday cup) was 35.4±3.8 pC with an energy of 11.5MeV and (initial) normalized emittance of 6.03±1.8 mm mrad. The beam was run on-crest, with an energy spread of approximately 0.5% and with sextupoles turned off.

For comparison, simulated beam profiles at each screen are shown below. Simulations were done using ELEGANT, matching the measured beamline parameters to the simulation. The simulated transverse beam dimensions agree with the measured values to within 30% except on the last screen, where the vertical beamsize is underestimated by 70%.
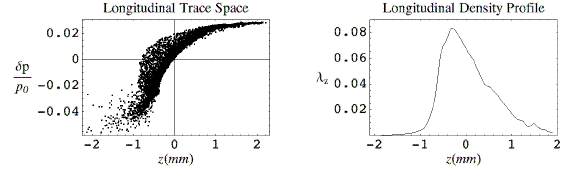
When this simulation is modified so that the input beam is chirped by 22 degrees, the resulting output beam is predicted to have a ramped current profile:
Horizontal Nonlinear Dispersion
A stable nondispersive operating point was determined empirically by observing the beam on the six profile monitors. The horizontal dispersion function (or R16) was minimized by observing the beam centroid position at the S-Bahn midpoint (Screen 11) under a variation of the fields of all magnetic elements on the dogleg (B1, B2, Q1, Q2) by a fractional offset [zeta] from those field values corresponding to the desired operating configuration. For a beam of constant central energy, the resultant shift in the centroid position is the same as that which would be observed due to a change in the central momentum by the same fractional amount and is given to second order in [zeta] by

Beam centroid data were fit to a quadratic to obtain the nonlinear second order dispersion term (T166) for several different sextupole configurations. These results are shown in the following table.
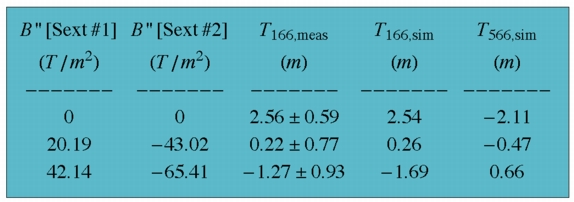
The simulation values from ELEGANT are shown for comparison, and they agree well with the measurements. The simulated values of the longitudinal dispersion T566 are given also, although at present no diagnostic is present on the beamline which would permit us to measure this quantity empirically.
Initial CTR Measurements
Initial bunch length studies were performed in the summer of 2003 before the S-Bahn was temporarily removed for installation work on the Neptune IFEL Experiment. A polarizing interferometer was used to autocorrelate the coherent transition radiation (CTR) produced by the beam at a copper mirror. A diagram of the interferometer is shown below. Also shown is example data of the Golay cell detector signal divided by the reference as a function of the delay on the translator in units of picoseconds.

Bunch length was measured by this method for several different sextupole field strengths. The resulting data (below) are compared with simulation results from ELEGANT. The dashed curve shows the RMS values of the bunch length from the simulation, while the solid curve shows the predicted CTR results obtained by Fourier transforming the simulation data and performing the CTR data analysis routine on it. In order to match the simulation results to the data, the laser pulse in the simulation had to be shortened to an RMS sigma of 0.85ps. The approximate empirical value of the laser pulse length is 3ps. The discrepancy may be due to clipping of the beam in a dispersive region (which may shorten the beam) or to possible temporal features of the laser pulse which are not taken into account in the simulation.
These results demonstrate that the S-Bahn works as a compression device, and that the sextupoles can be successfully used to manipulate the longitudinal shape of the bunch. Note also that the sextupole field (1200 inverse cubic meters) corresponding to the maximum compression is also the sextupole field predicted by ELEGANT to eliminate T566.